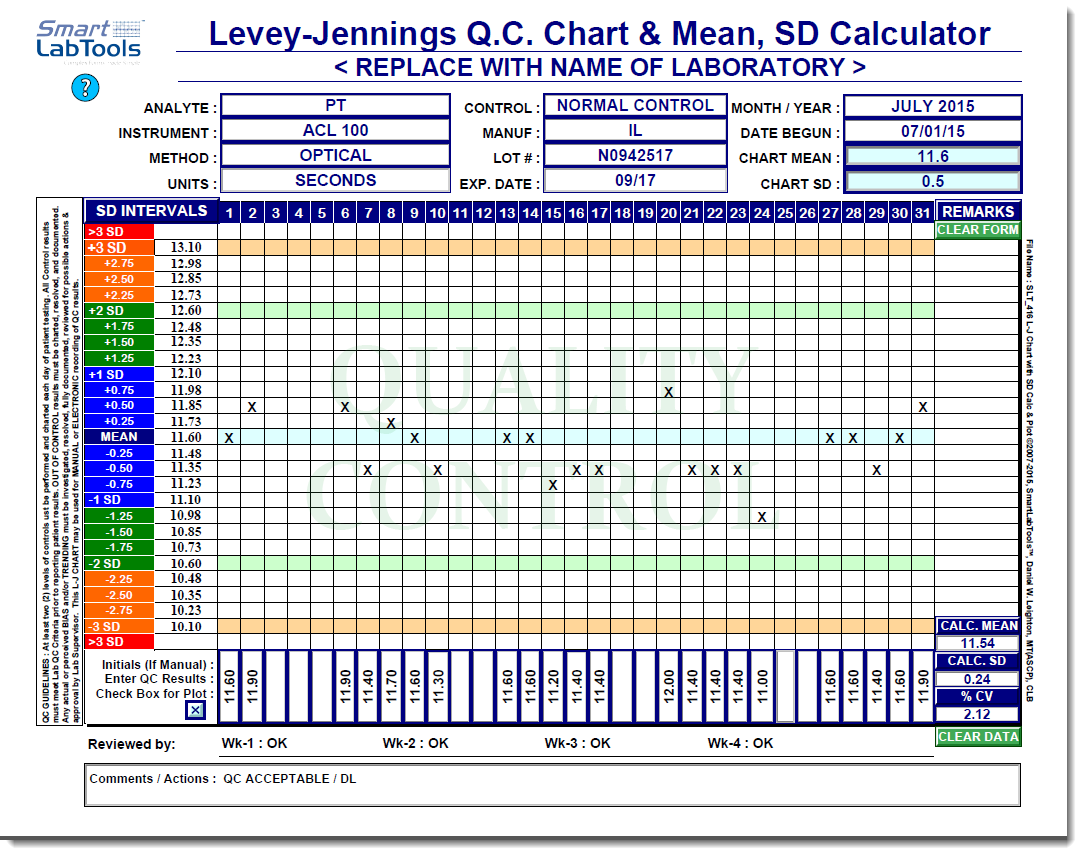
Dynamic Levy-Jennings Chart Watch Demo Below!
Simple to Use Instructions:
- Enter Demographics
- Enter Chart Mean (to start)
- Enter Chart SD (to start)
- SD Intervals are automatically created. [Save] and [Print] for use as a MANUAL QC Chart, i.e. Mark an X on the Chart and Record the Value below
- At any time, go back to saved Chart and enter QC data into Form (data only no X's)
- QC Statistics are generated as you enter the data
- Optionally replace the initial Mean, SD with the newly calculated Mean, SD
- Click on Box to Create X's For a QC Graph as shown
Features:
- Entry of Chart Mean, SD automatically scales SD intervals
- Use as Manual QC chart or
- Enter results to calculate QC statistics
- Click on check box to plot QC graph
SLT_416 Levey-Jennings Chart & Calculator